Earth Science worksheet
    Topic: Equilibrium And Stability
    Equilibrium And Stability
    1

    Which graph best shows the general relationship between a planet’s distance from the Sun and the Sun’s gravitational attraction to the planet?

    seasons-and-astronomy, motion-of-objects-in-the-solar-system, standard-6-interconnectedness, models, standard-6-interconnectedness, equilibrium-and-stability fig: esci12014-examw_g8.png

    (1) 1

    (2) 2

    (3) 3

    (4) 4

    Base your answers to questions 2 on the diagram below and on your knowledge of Earth science. The diagram represents Earth’s revolution around the Sun. Points A, B, C, and D represent Earth’s positions in its orbit on the first day of each of the four seasons. The major axis and the foci (the center of the Sun and the other focus) of Earth’s orbit are shown.

    reference-tables, solar-system-data, seasons-and-astronomy, motion-of-objects-in-the-solar-system, standard-1-math-and-science-inquery, eccentricity-rate-gradient-standard-error, standard-1-math-and-science-inquery, geocentric-model-heliocentric-model, standard-1-math-and-science-inquery, changing-length-of-a-shadow-based-on-the-motion-of-the-sun, standard-6-interconnectedness, models fig: esci12015-examw_g36.png

    2

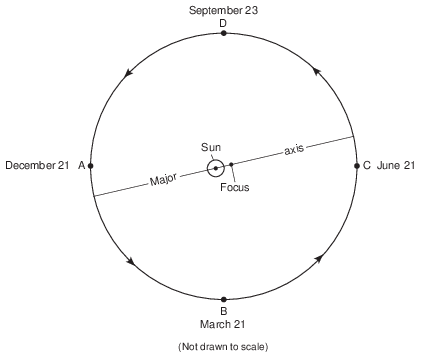
    Since Earth has an elliptical orbit, the

    (1) distance between the Sun and Earth varies

    (2) distance between the Sun and the other focus varies

    (3) length of Earth’s major axis varies

    (4) length of Earth’s period of revolution varies

    3

    The gravitational attraction between two objects in the solar system is greatest when their masses are

    (1) small, and the objects are close together

    (2) small, and the objects are far apart

    (3) large, and the objects are far apart

    (4) large, and the objects are close together

    4

    The diagram below represents planets A and B, of equal mass, revolving around a star.

    reference-tables, solar-system-data, seasons-and-astronomy, motion-of-objects-in-the-solar-system, standard-1-math-and-science-inquery, changing-length-of-a-shadow-based-on-the-motion-of-the-sun, standard-6-interconnectedness, equilibrium-and-stability fig: esci82013-exam_g4.png

    Compared to planet A, planet B has a

    (1) weaker gravitational attraction to the star and a shorter period of revolution

    (2) weaker gravitational attraction to the star and a longer period of revolution

    (3) stronger gravitational attraction to the star and a shorter period of revolution

    (4) stronger gravitational attraction to the star and a longer period of revolution

    Base your answers to questions 5 on the diagram below, which shows several different landscape features. Points X and Y indicate locations on the streambank.

    landscapes, erosion-and-natural-agents-of-erosion, standard-1-math-and-science-inquery, geocentric-model-heliocentric-model fig: esci12012-examw_g40.png

    5

    Identify which point, X or Y, has more stream erosion and explain why the amounts of erosion are different. [1]

    Point:

    Explanation:

    Allow 1 credit for X and a correct explanation. Acceptable explanations include, but are not limited to:

    • — Point X is on the outside of a meander curve.

    • — Stream velocity is greater at point X.

    • — More deposition occurs at Y.

    Base your answers to questions 6 on the data table below and on your knowledge of Earth science. The table shows the distances from Earth to the Moon for certain days during December 2010. The percent of the Moon illuminated by the Sun as seen from Earth is also given.

    seasons-and-astronomy, motion-of-objects-in-the-solar-system, seasons-and-astronomy, the-solar-system, standard-1-math-and-science-inquery, eccentricity-rate-gradient-standard-error fig: esci12016-examw_g44.png

    6

    On which date shown in the data table was the gravitational attraction between the Moon and Earth the greatest? [1]

    December _________, 2010

    Allow 1 credit for December 24, 2010.

    Base your answers to questions 7 on the diagram below and on your knowledge of Earth science. The diagram represents a portion of a stream and its surrounding bedrock. The arrows represent the movement of water molecules by the processes of the water cycle. The water table is indicated by a dashed line. Letter A represents a water cycle process occurring at a specific location. Letter d represents the distance between the water table and the land surface.

    landscapes, water-recycle, meteorology, water-cycles, standard-6-interconnectedness, models fig: esci62013-examw_g46.png

    7

    Explain why the distance, d, from the water table to the land surface would decrease after several days of heavy rainfall. [1]

    Allow 1 credit. Acceptable responses include, but are not limited to:

    • — The heavy rainfall will infiltrate the ground, causing the water table to rise closer to the

    • surface.

    • — Infiltration will occur.

    • — The ground becomes more saturated.

    • — The saturated zone will increase.

    • — The water table will rise.

    • — erosion of the land surface

    • Note: Do not allow credit for the process of weathering acting alone.

    Base your answers to questions 8 on the diagram below and on your knowledge of Earth science. The diagram represents the Moon at eight numbered positions in its orbit around Earth. The nighttime sides of the Moon and Earth are shaded.

    seasons-and-astronomy, motion-of-objects-in-the-solar-system, standard-6-interconnectedness, models, standard-6-interconnectedness, patterns-of-change fig: esci62013-examw_g48.png

    8

    Explain why the Moon’s orbital velocity is slowest when the Moon is farthest from Earth. [1]

    Allow 1 credit. Acceptable responses include, but are not limited to:

    • — The gravitational attraction between the Moon and Earth is least when they are farthest

    • apart.

    • — The force of gravity is less.

    • — Gravitational attraction is greater when the Moon is closer to Earth.

    Base your answers to questions 9 on the diagram below and on your knowledge of Earth science. The diagram represents the Moon in eight positions in its orbit around Earth. One position is labeled A.

    seasons-and-astronomy, motion-of-objects-in-the-solar-system, standard-6-interconnectedness, systems-thinking, standard-6-interconnectedness, models fig: esci62016-examw_g45.png

    9

    Explain why the Moon’s revolution and rotation cause the same side of the Moon to always face Earth. [1]

    Allow 1 credit. Acceptable responses include, but are not limited to:

    • — The Moon’s period of rotation equals the Moon’s period of revolution.

    • — The Moon rotates at the same rate that it revolves around Earth.

    • — The Moon spins once during each revolution.

    • — Both motions are completed in 27.3 days.

    Base your answers to questions 10 on the diagram below and on your knowledge of Earth science. The diagram represents a planetary system, discovered in 2013, with seven exoplanets (planets that orbit a star other than our Sun) labeled b through h orbiting a star. The exoplanet orbits are represented with solid lines. For comparison, the orbits of three planets of our solar system are shown with dashed lines. The sizes of the star, exoplanets, and planets are not drawn to scale.

    seasons-and-astronomy, the-solar-system, standard-6-interconnectedness, models fig: esci62017-exampwr_g36.png

    10

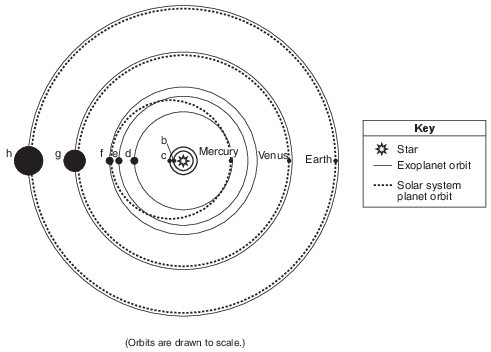
    Identify the letter of the exoplanet with the shortest period of revolution and explain why that exoplanet has the shortest period of revolution. [1]

    Exoplanet: Explanation:

    Allow 1 credit for exoplanet b with an acceptable explanation. Acceptable explanations include, but are not limited to:

    • — The planet closest to the star moves fastest due to greatest gravitational force.

    • — It is closest and has the least distance to travel in its orbit.

    • — The planet with the shortest period of revolution is always the planet that is nearest to the

    • star.

    • — The closer to the star, the faster an exoplanet orbits.

    • — closest to the star/Sun

    • — Exoplanet b has the smallest/shortest orbit.

    Base your answers to questions 11 on the block diagram below and on your knowledge of Earth science. The block diagram represents a region of sedimentary rock that has been intruded by magma, which has since solidified. Points X and Y identify locations at the boundary between the igneous intrusion and surrounding sedimentary rock layers. Letters A and B represent specific rock units. Letter C represents rock formed from the lava flow of the nearby volcano. The rock layers have not been overturned.

    rocks-and-minerals, formation-classification-and-application-of-rocks, standard-1-math-and-science-inquery, geocentric-model-heliocentric-model, standard-1-math-and-science-inquery, changing-length-of-a-shadow-based-on-the-motion-of-the-sun, standard-6-interconnectedness, models, standard-6-interconnectedness, patterns-of-change fig: esci62019-examw_g45.png

    11

    State the names of two different metamorphic rocks that are most likely found in the zone of contact metamorphism at locations X and Y. [1]

    Location X: Location Y:

    Allow 1 credit if both responses are correct. Acceptable responses include:

    • Location X:

    • — marble

    • — hornfels

    • Location Y:

    • — quartzite

    • — hornfels

    • Note: Do not allow credit if hornfels is used for both locations X and Y.

    Base your answers to questions 12 on the map below, which shows a portion of New York State and Canada. The arrows represent the direction of the wind blowing over Lake Ontario for several days early one winter.

    climate, climate-of-a-location, standard-1-math-and-science-inquery, geocentric-model-heliocentric-model, standard-6-interconnectedness, systems-thinking fig: esci82012-examw_g46.png

    12

    Explain why the surface of Lake Erie freezes much later in the winter than the surrounding land surfaces. [1]

    Allow 1 credit. Acceptable responses include, but are not limited to:

    • — Water has a higher specific heat than land.

    • — Water takes a longer time to cool than land.

    • — Land surfaces cool faster.